


Where’s Best to Buy? Market Analysis
While the Bitcoin market might have been torturous lately, we'll take a look at some realistic metrics that could determine the bottom

Every new week, investors and traders are searching for the ultimate Bitcoin bottom signal, however, the price action continues to indicate otherwise.
While Bitcoin has remained fairly stable around the $28,000-$30,000 region over the last two weeks, there has been little or nothing from the price action to signify strength from buyers, with the price forming a descending triangle, coupled with a dwindling volume. Global macroeconomic events have not been of help either.

A further look at some key technical indicators provides insight into why investors are currently skeptical of any form of a price reversal, even with the Bitcoin "Fear and Greed Index" matching the lows of the March 2020 covid dump.
From the chart below, we can see that every time the price of Bitcoin crossed below the 20 weekly moving average(orange line), it has gone on to test the 200 weekly moving average as bottom(green line). The bear market bottom in 2018 also seems to have been marked by a 20/100 MA cross on the weekly candle.

On the current Bitcoin chart, we’re yet to witness the 20/100 WMA cross, although it’s close. A price dump towards the $22,000-$20,000 lows would probably signal that awaited MA cross. The 200WMA is currently priced at $22064 as at the time of writing.
A deeper dive into onchain
The RHODL Ratio, which examines the ratio between RHODL band of 1 week versus the RHODL band of 1-2 years is a key indicator that has almost accurately predicted the price high of previous macro cycles. The RHODL ratio entering into the red band often signals that the market is approaching the cycle top as it has done in previous cycles. However, from the chart below, it is obvious that the RHODL ratio did not get into the red bands. Almost everyone could agree at this point that the last Bitcoin bull run did not experience a blow-off top which many investors were waiting for to sell off.
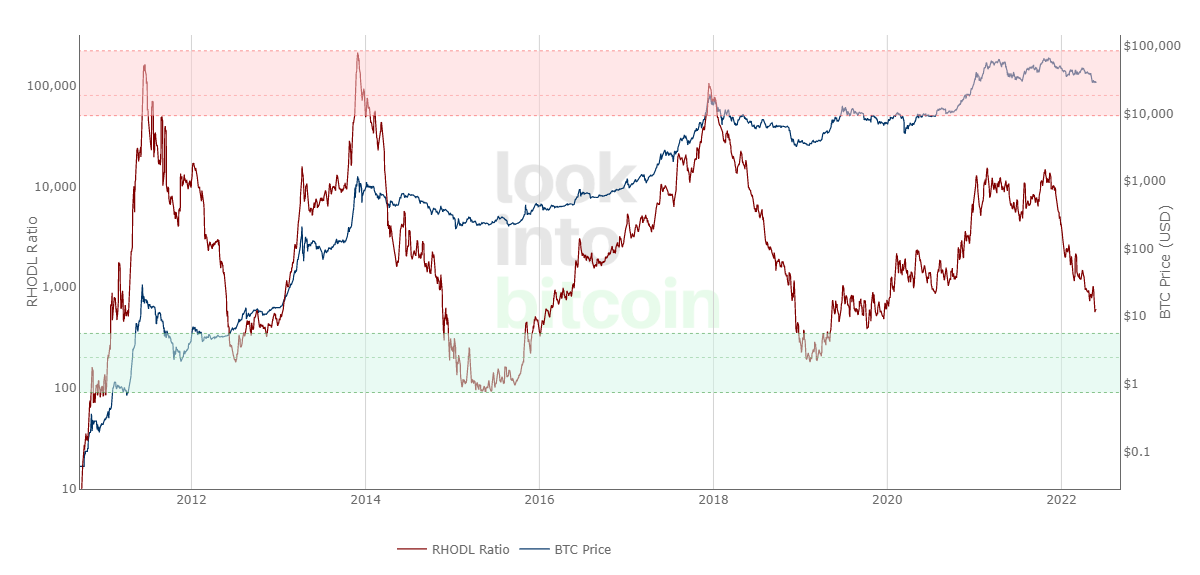
On the other hand, when the RHODL ratio drops into the lower green band, it’s a good sign that the market is about to bottom. The chart above shows that we’re still a little way off from the green band, with the RHODL ratio currently sitting at 594.14. The RHODL ratio is one onchain indicator that has a unique advantage, in that it does not provide false signals.
Somewhat similar to the RHODL ratio, another important onchain indicator to keep an eye on is the MVRV Z-score. This indicator utilizes blockchain analysis to identify periods where Bitcoin is extremely over/undervalued relative to its ‘fair value’.
Previous market bottoms have been easily identified when the market value (blue line) touches or even goes below the realised value (orange line). You might want to know that the Realised Value takes the price of each Bitcoin when it was last moved, adds up all those individual prices, takes an average of them, and then multiplies that average price by the total number of coins in circulation.
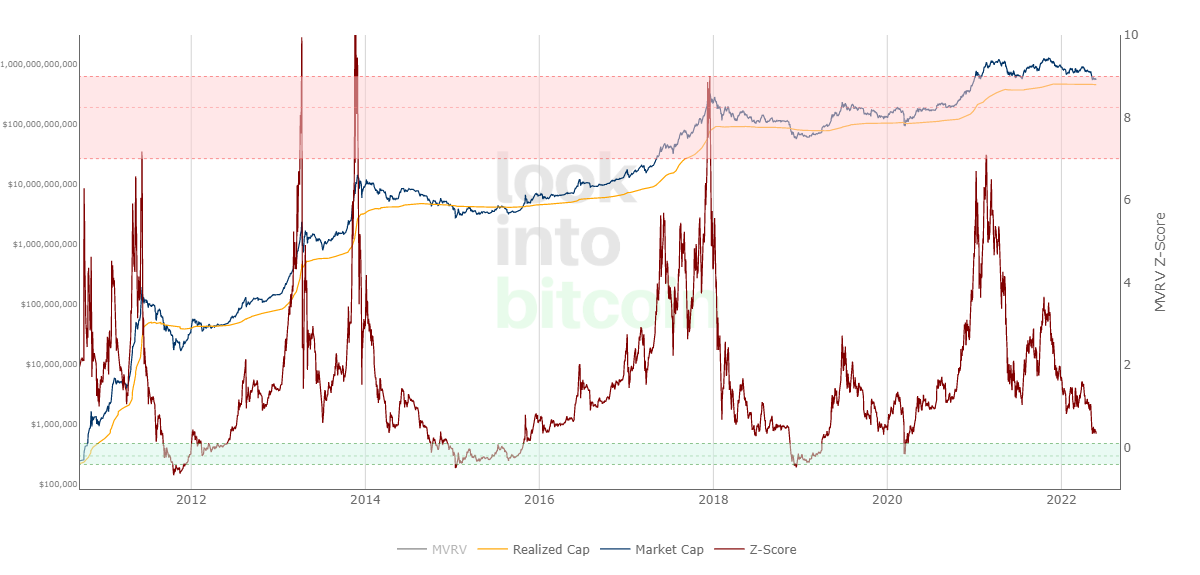
The z-score(red line) is useful in picking out macro bottoms whenever it enters the green box, showing that the market value is far below the realised value. It might be important to mention that the redline hasn’t retested the green box yet.
What now?
Paying attention to fundamental, technical, and onchain metrics is necessary for investors and traders to make intelligent decisions. However, if the majority of the market already knows something, there’s a good chance it could be front-run by market makers. This is probably the same reason Bitcoin never had a blow-off top. Looking at the onchain charts above, we can deduce that the key cycle top indicators didn’t play to the book as well.
Personal opinion
There’s no need to try to be a perfect investor/trader. Dollar-cost averaging into your Bitcoin or Altcoin positions right now would be a smart thing to do, should be market be, by any chance front-run just like it was from the top. That would otherwise be a total waste of patience if you miss out on the gains, right?
Understand that this isn’t any guarantee that Bitcoin will not hit those predicted lows or even go beyond it. However, to make the best of opportunities, you must try to be one step ahead by giving some room for exposure. Prices have certainly gone beyond a point where they will smash through in the next Crypto bull run.
If you enjoyed this analysis, feel free to share it, and subscribe to Bitville newsletter using the button below.